An interactive chapter
An apparatus you can move.
Here, a labor supply-and-demand chart — the model both sides of the debate are arguing inside. Drag the floor and watch the prediction respond.
There's no shortage of good learning material. The bottleneck is purpose.
We want answers to the big questions in fields we care about. Are high interest rates good for the economy? Do trade wars help us? Did Keynes mean what the textbook says? To take these seriously you dig past the headline — sometimes through an interactive chapter, sometimes through a traced lineage of each side, sometimes through an empirical atlas. The panels below show all three, on one example.
Here, a labor supply-and-demand chart — the model both sides of the debate are arguing inside. Drag the floor and watch the prediction respond.
Here, the standard view: "in a competitive labor market, raising the wage above equilibrium reduces hiring." Stigler · Friedman · Neumark.
Here, the monopsony view: "real labor markets aren't competitive. A binding floor can pull wages closer to marginal product." Robinson · Card & Krueger · Dube.
Here, state-by-state minimum wages and employment effects. Card & Krueger ran their natural experiment on the NJ–PA border; the empirical fight is conducted on this map.
More on offer — same shape, different question.
Geography vs. institutions vs. culture vs. luck — four families of answers, each with the empirical work that picks between them.
Open the question →The textbook says money supply ↑ → prices ↑. The 2008–2020 record didn't read that way. What was actually being measured?
Open the question →Behavioral says no, in patterned ways. The standard model says yes, in expectation. The fight is over which model wins where.
Open the question →— or write your own —
Each topic is a container — textbook, Big Questions, atlases, history-of-thought timeline — sharing one editorial spine. Click a side cover to rotate; click the centered cover to open.
An atlas here is an interactive view you can poke at — a time-scrubbed map, a network you can pivot, a layered chart with toggles. Each one lets you find the same period or place across multiple lenses.
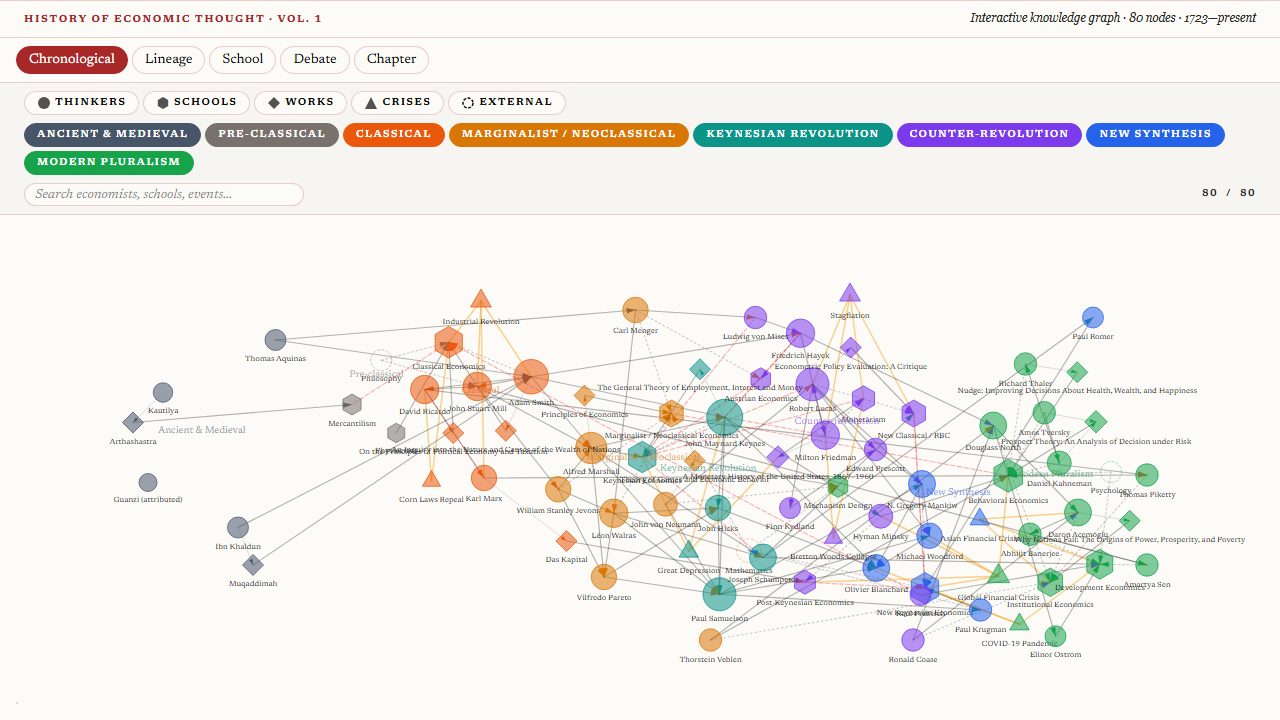
Who influenced whom — Aquinas through Acemoglu
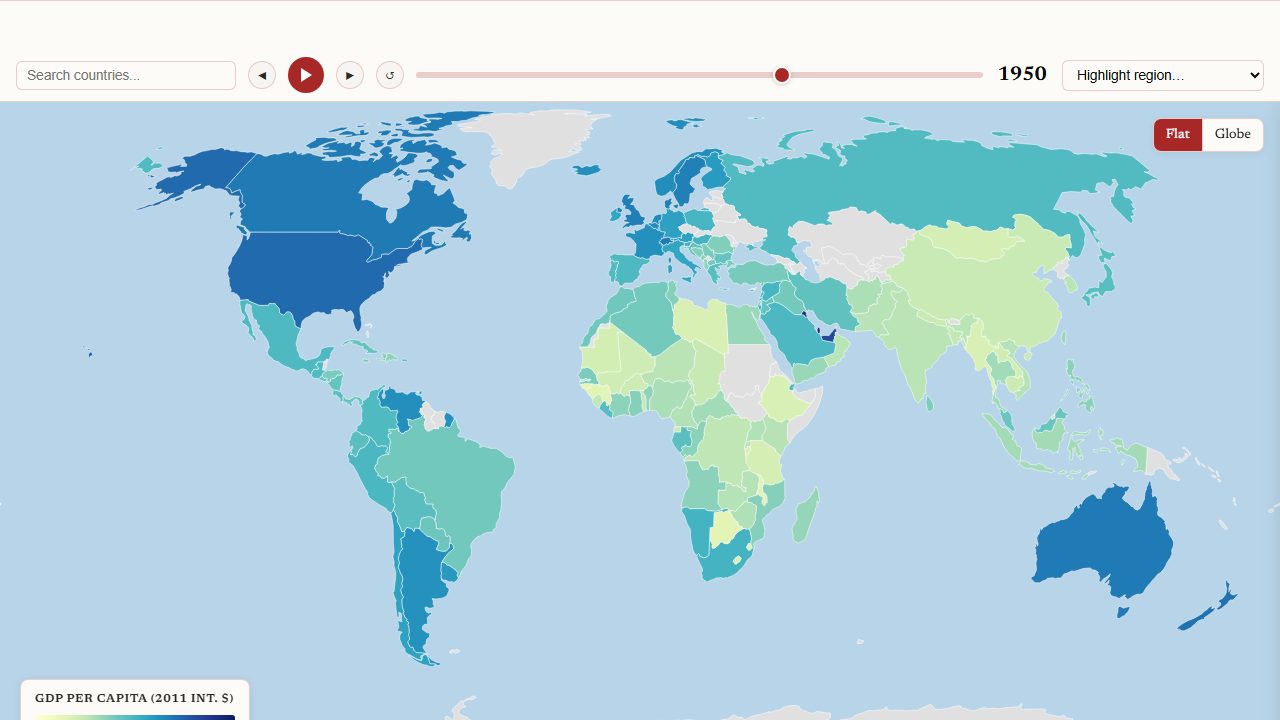
A choropleth you can scrub from 1820 to today — flat or globe
Short, sharp pieces on a current claim or news event — engaged head-on, then taken apart with citations to the chapters and Big Questions that bear on it. The provisional layer; where ideas go before they earn a Big Question.
The standard response to the AI-displacement worry runs through the Solow paradox: new technology, by raising productivity, eventually raises real wages — that's the textbook conclusion, sketched in any introductory growth model. The empirical record from 1980 forward is harder to read that way. Median wages decoupled from productivity for thirty years inside the same economy that produced the Solow result.
If your time horizon is a generation, "eventually" is a defensible answer. If your time horizon is a working life, it isn't — and most of the people doing the worrying are working their working life. The model and the lived experience aren't disagreeing about the mechanism; they're disagreeing about what counts as "soon enough."
Read the take →